

This calculator estimates your practice's potential savings from automating insurance appeals, using your own monthly revenue, appeal volume, and staff hourly rate — not a blanket industry number. For context: a 2023 national survey of 280 hospitals found the average cost to fight one denied claim was $57.23 in staff labor (Premier Inc., published Feb 2025). Muni Appeals costs $20 per appeal, with the first 3 free.
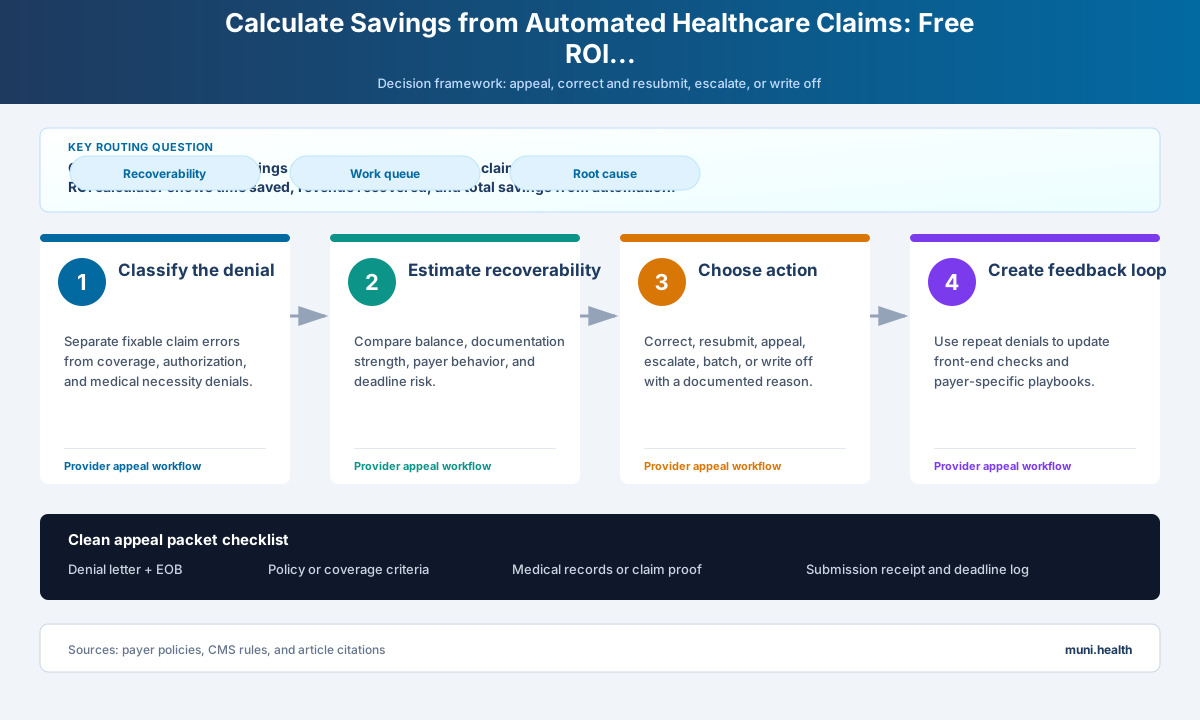
Calculate Your Potential Savings from Automated Healthcare Claims
Calculate Your Savings with Muni Appeals
See how much time and money your practice could save by automating insurance appeals.
*Calculations use modeled assumptions: a commonly cited industry-average appeal success rate (~67%) improving to a benchmark for complete, well-documented appeals (~80%), manual appeal time of 45 minutes vs 5 modeled minutes with Muni, and $20 per appeal (first 3 free). These are estimates, not measured Muni statistics — actual results vary by practice.
Why Calculate Your Healthcare Claims Automation ROI?
Claims adjudication — including the cost of fighting denials — cost U.S. hospitals and health systems an estimated $25.7 billion in 2023, according to a national survey of 280 hospitals and health systems conducted by Premier Inc. Because roughly 70% of denials are ultimately overturned and paid, the survey estimated that nearly $18 billion of that spend went toward claims that should have been paid the first time (Premier Inc., published Feb 24, 2025). That's hospital-system data, not an independent-practice-specific figure, but the underlying dynamic — most of the cost is staff labor, not the claim itself — holds at any practice size.
Most practices don't realize how much of that cost is happening in their own billing office because they:
- don't track staff time spent per appeal
- don't compare their actual denial rate against what they're recovering
- have never compared manual labor cost against a per-appeal automation price, or against what an outsourced billing service's percentage-of-collections fee would run for the same work — see Outsourced Billing Service vs. Appeal Automation for that comparison
What Actually Drives the Cost
The same Premier survey found the average cost to fight a denied claim rose from $43.84 in 2022 to $57.23 in 2023 — a 30% increase in one year — and that labor accounted for 90% of that cost, not software, postage, or filing fees.
Key Statistic
The average cost to fight one denied claim rose 30% year-over-year, from $43.84 (2022) to $57.23 (2023), in a national survey of 280 hospitals and health systems. Source: Premier Inc., published Feb 24, 2025.
Prior authorization work adds to that burden before an appeal is ever filed: the AMA's 2024 Prior Authorization Physician Survey (n=1,000 physicians) found PA consumes an average of 13 hours of physician and staff time per week (AMA, published Dec 2024). Appeals compete for that same staff time.
How the Calculator Estimates Your Savings
The calculator above uses three adjustable inputs — your monthly revenue, appeals filed per month, and your billing staff's hourly rate — plus two modeled assumptions it discloses directly in the results:
- Manual appeal time defaults to 45 minutes per appeal, a commonly cited estimate for research, documentation, drafting, and submission combined. You can see this reflected in the "Manual appeal time" line in your results.
- Appeal success rate models an improvement from a commonly cited industry-average rate toward a benchmark for complete, well-documented appeals. This is an adjustable modeling assumption, not a measured Muni statistic — actual results depend heavily on denial type, documentation quality, and payer.
Muni's cost is not modeled — it's the actual published price: $20 per appeal, first 3 free, no subscription (muni.health/pricing).
Because the revenue-recovery estimate depends on an assumption rather than a guarantee, treat the "Additional Recovery" figure as directional. The "Time Saved" and "Muni Annual Cost" figures are closer to fact, since they're built from your own inputs and Muni's published price rather than a modeled success-rate jump.
See what a $20 appeal actually includes
Muni drafts the letter, cites the payer's policy, and builds the evidence checklist — you review and submit.
First 3 appeals free, then $20 per appeal. Start with your denial letter or EOB and available records. No meeting or clearinghouse connection required.
What Actually Drives Appeal Success
Appeal outcomes vary far more by denial type and documentation completeness than any single "success rate" number captures. In KFF's analysis of 2024 ACA marketplace data, insurers upheld their original denial in about two-thirds of internal appeals filed by consumers — meaning roughly a third succeeded — and fewer than 1% of denied in-network claims were ever appealed in the first place (KFF, 2024 data). That figure covers all appealed claims, not just well-documented medical necessity appeals specifically, so it isn't directly comparable to a provider-side, fully-documented appeal.
Prior authorization appeals tell a different story when the denial is procedural rather than clinical: KFF's analysis of CMS data found insurers fully or partially overturned 83.2% of Medicare Advantage prior authorization appeals in 2022 (AMA, citing KFF/CMS data) — evidence that a properly filed, well-documented appeal often succeeds even where the initial denial rate is high.
The practical takeaway: which denials are worth appealing, and how likely they are to succeed, depends on denial type and documentation — not a single blended percentage. See When to Appeal an Insurance Denial: Decision Framework for the full triage breakdown by denial type.
Muni Appeals doesn't publish a blended success-rate percentage, since outcomes depend on documentation quality, denial type, and payer — the same factors that make a single industry-wide number unreliable in the first place.
Time Not Spent on Appeals
Every hour not spent researching and drafting a denial appeal is an hour available for patient care coordination, insurance verification, or denial-prevention work upstream — the calculator's "Time Saved" figure above is a starting point for what that could look like at your practice's actual volume.
What's Included in Muni Appeals Pricing
First 3 appeals free, then $20 per appeal. No subscription.
- Drafted appeal letter with payer-policy citations
- Evidence checklist and recommended next step
- Credits never expire
- No credit card required to start
- No setup fees, no contracts
- BAA signed with every customer; data encrypted in transit and at rest
Details current as of publish date — verify current pricing at muni.health/pricing.
Frequently Asked Questions
How accurate is the ROI calculator?
The calculator uses adjustable, disclosed assumptions rather than a fixed formula presented as fact: a default 22% denial rate, 45-minute manual appeal time, and a modeled improvement from a commonly cited industry-average success rate toward a benchmark for well-documented appeals. You can override the denial rate and hourly rate with your own numbers. Treat the time-savings and cost figures as closer to fact (they use your inputs and Muni's published price) and the revenue-recovery figure as directional, since it depends on a modeled success-rate assumption, not a guarantee.
What if my practice has fewer than 8 appeals per month?
Muni's pricing has no minimum — you pay $20 per appeal with no subscription, so low volume doesn't carry fixed overhead the way a monthly tool would. The first 3 appeals are free regardless of your monthly volume, so you can see the actual product before deciding whether the per-appeal cost makes sense at your volume.
Does this include prior authorization denials?
Yes, Muni handles prior authorization appeals as well as claim denials. PA appeals are often worth prioritizing because they're time-sensitive — the patient is typically waiting on treatment — and because well-documented PA appeals tend to succeed at a high rate: KFF's analysis of CMS data found insurers overturned 83.2% of Medicare Advantage PA appeals in 2022 (AMA, citing KFF/CMS data).
Can I try Muni before committing?
Yes. Your first 3 appeal credits are free with no credit card required. Run your actual denials through the product and see the results before paying anything.
Ready to Calculate Your Actual Savings?
The calculator above uses your numbers, not a blanket industry average. Enter your monthly revenue, appeal volume, and staff hourly rate to see a modeled estimate — then compare it against Muni's actual price.
Start with 3 free appeal credits:
- No credit card required
- Full product access
- 3 appeals free, then $20 per appeal, no subscription
Industry figures in this post are cited and linked to their original sources (Premier Inc., AMA, KFF) with the year the underlying data reflects. The ROI calculator's revenue-recovery estimate is a modeled, adjustable assumption disclosed in its own results — not a measured Muni statistic or a guaranteed outcome. Muni pricing reflects the published price at muni.health/pricing as of the date above and is subject to change.